Gartner’s Magic Quadrant is one of the most influential research tools for evaluating technology vendors.
It ranks companies based on two key dimensions
Ability to Execute (how well they deliver today)
Completeness of Vision (how well they anticipate the future).
However, while the Quadrant offers a useful snapshot of the competitive landscape, it can mislead when taken at face value.
IT leaders should use it as a starting point for strategic evaluation not as the final decision-maker.
True value comes from combining Gartner’s insights with hands-on testing, TCO analysis, and real-world fit to organizational goals.
The world of enterprise technology, few research outputs carry as much weight as Gartner’s Magic Quadrant reports. For decades, these iconic charts have influenced boardroom discussions, vendor strategies, and procurement decisions. But while many executives and IT leaders cite Magic Quadrants when selecting vendors, fewer understand how to interpret them critically.
This article unpacks what Magic Quadrants are, why they matter, what they don’t show, and how organizations especially SMBs and mid-market companies should use them as one tool among many in technology evaluation.
Gartner and the Role of Industry Analysts
Gartner is one of the world’s leading research and advisory firms, founded in 1979 and headquartered in Stamford, Connecticut. With thousands of analysts worldwide, Gartner covers virtually every segment of enterprise IT: cloud services, cybersecurity, networking, data management, ERP, and more.
The firm’s analysts conduct surveys, interview customers, review product capabilities, and analyze financial and strategic data from vendors. Gartner’s influence stems not only from its published research but also from the consulting and advisory services it provides to both enterprises and technology vendors.
The Magic Quadrant, first introduced in the 1990s, quickly became Gartner’s most recognizable deliverable. Its simplicity a two-axis grid dividing vendors into four categories—made it accessible to decision-makers at every level. But this simplicity also creates risks of over-reliance or misinterpretation, which we’ll explore later.
How to Read the Magic Quadrant
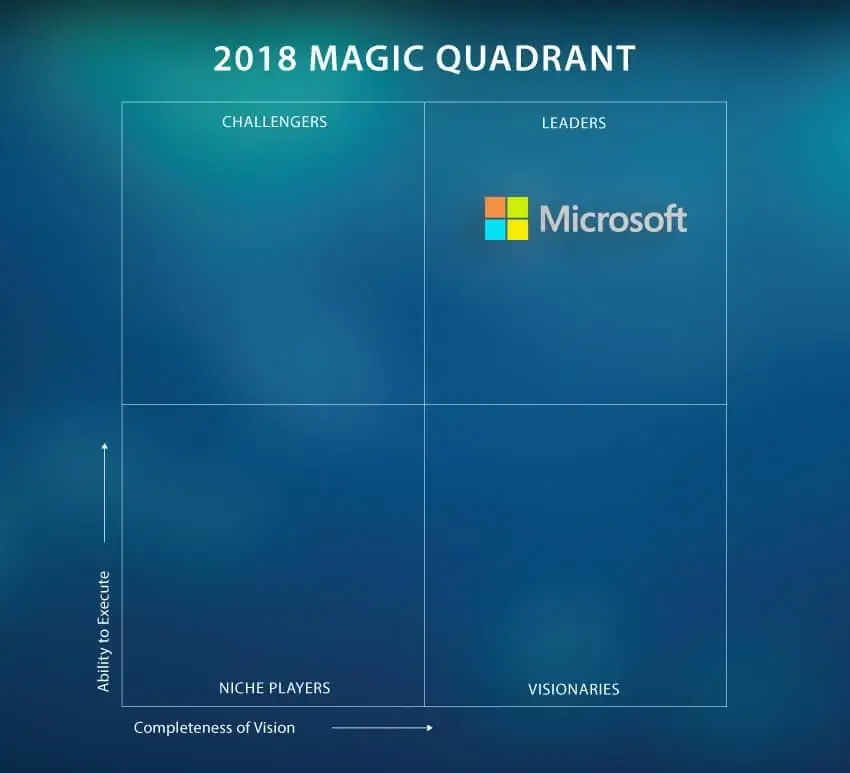
The Magic Quadrant places vendors into four quadrants based on two axes:
Ability to Execute | How well the company delivers its products today. This includes product quality, customer experience, sales execution, and financial stability.
Completeness of Vision | How well the company anticipates future trends. This reflects innovation, market understanding, product roadmaps, and long-term strategy.
The four quadrants
Leaders | vendors with strong execution and visionary roadmaps. They often dominate their markets.
Challengers | Vendors that execute well but may lack long-term vision or innovation.
Visionaries | Innovators with compelling strategies but less proven ability to deliver consistently at scale.
Niche Players | Focused providers with strengths in specific markets or geographies, but limited reach or broader impact.
At first glance, many readers gravitate toward the “Leaders” quadrant, assuming those vendors are universally best. This is a mistake.
What Matters and What Doesn’t in the Quadrant
What matters
The relative positioning of vendors, not just who is in the Leaders box. A strong Visionary may be a better fit for a forward-looking company than a conservative Leader.
The movement of vendors year over year. Are they improving execution? Is their vision gaining traction? Trends matter more than static placement.
The analyst commentary that accompanies the chart. The visual is a summary; the text provides nuance, including strengths, cautions, and customer feedback.
What matters less
The exact placement within a quadrant. Being slightly higher or more to the right does not necessarily mean a vendor is “better.”
Assuming one size fits all. Leaders are not automatically the best choice for SMBs, which may benefit from Niche Players offering specialized support and cost-effective solutions.
Treating the Quadrant as a scorecard. It is not designed to “rank” vendors but to show relative positioning in a given market at a given time.
Why Magic Quadrants Can Mislead
While Gartner’s methodology is rigorous, Magic Quadrants are not infallible. Key limitations include:
Vendor-driven data | Much of the input comes directly from vendors, which can influence how capabilities are represented.
Market scope definitions | Gartner defines market segments narrowly; a vendor might excel outside that scope but appear weaker within the Quadrant.
Bias toward scale | Large vendors with broad customer bases and financial stability tend to score higher, even if their solutions aren’t the best fit for smaller businesses.
Lagging indicators | Magic Quadrants are published annually. In fast-moving areas like AI or cloud security, market realities can change within months.
For these reasons, relying solely on a Magic Quadrant can lead to misaligned vendor choices.
How to Use Magic Quadrants Effectively
As a starting point | They provide a snapshot of the competitive landscape, helping shortlist vendors quickly.
For strategic context | They highlight which vendors are shaping the future versus those primarily focused on execution.
To guide discussions | They help IT leaders engage with executives and boards using a clear visual framework.
How to choose from the leaders List
Conduct proof-of-concepts and pilots to validate product fit.
Evaluate total cost of ownership (TCO) and integration complexity, which Magic Quadrants don’t cover in depth.
Consider cultural fit how a vendor collaborates, supports, and innovates with its customers.
Leverage additional research, such as Gartner’s Critical Capabilities reports, Forrester’s Wave reports, or independent community reviews.
Ultimately, the best vendor is the one aligned with your company’s size, strategy, and risk profile, not the one placed furthest to the top-right of a chart.
Gartner’s Magic Quadrants remain one of the most influential tools in enterprise IT decision-making. They provide clarity in complex markets and help organizations quickly understand vendor positioning. But they are neither perfect nor prescriptive.For SMBs and enterprises alike, the key is to treat Magic Quadrants as a map, not a destination. They show where vendors stand relative to one another, but they cannot decide what is right for your specific business needs. By combining Gartner’s insights with hands-on evaluation, peer reviews, and strategic planning, IT leaders can make informed, resilient choices.

It’s a visual framework that categorizes vendors into four groups Leaders, Challengers, Visionaries, and Niche Players based on their ability to execute and completeness of vision.
It helps IT leaders quickly see how vendors compare in a specific market segment.
Ability to Execute measures operational excellence, product reliability, and customer satisfaction.
Completeness of Vision reflects innovation, market understanding, and long-term strategy.
Not necessarily. “Leaders” often serve large enterprises, while SMBs may benefit from Visionaries or Niche Players that offer better support, lower cost, and flexible integration.
It’s vendor-driven much data comes from vendor submissions.
It reflects a specific market scope, which might exclude innovative solutions outside Gartner’s definition.
It favors large vendors with global scale.
It’s a snapshot, not a real-time reflection of current conditions.
Use it to shortlist vendors, not to make final decisions.
Read the analyst commentary, not just the chart.
Run proof-of-concept tests before buying.
Compare with other research (Forrester Wave, Peer Insights, etc.).
Factor in cultural fit, TCO, and post-sale support.
Look at trends over time whether a vendor is improving or declining — and read the detailed notes for context.
The position itself (a few pixels higher or lower) isn’t what defines real-world performance.
By using them as a research accelerator: to identify potential partners, understand market maturity, and align vendor strategies with SMB needs.
However, SMBs should balance Gartner insights with practical experience and independent evaluations.
References
Gartner – Magic Quadrant Methodologies
NIST – IT Evaluation Standards
Gartner Magic Quadrant – Gratner
Analyzing the Analysts: Comparison of Gartner and Forrester – analystrelations
Forrester and Other Analyst Firms: The Future of the Search Industry – lucidworks